We’ve developed a carbon abatement cost curve to help track our emissions reduction targets (Scope 1 and 2 excluding electricity distribution losses). This includes reaching net carbon zero by 2030, as well as meeting a science-aligned reduction target of 53.5% by 2030.
Vector's marginal carbon cost abatement curve
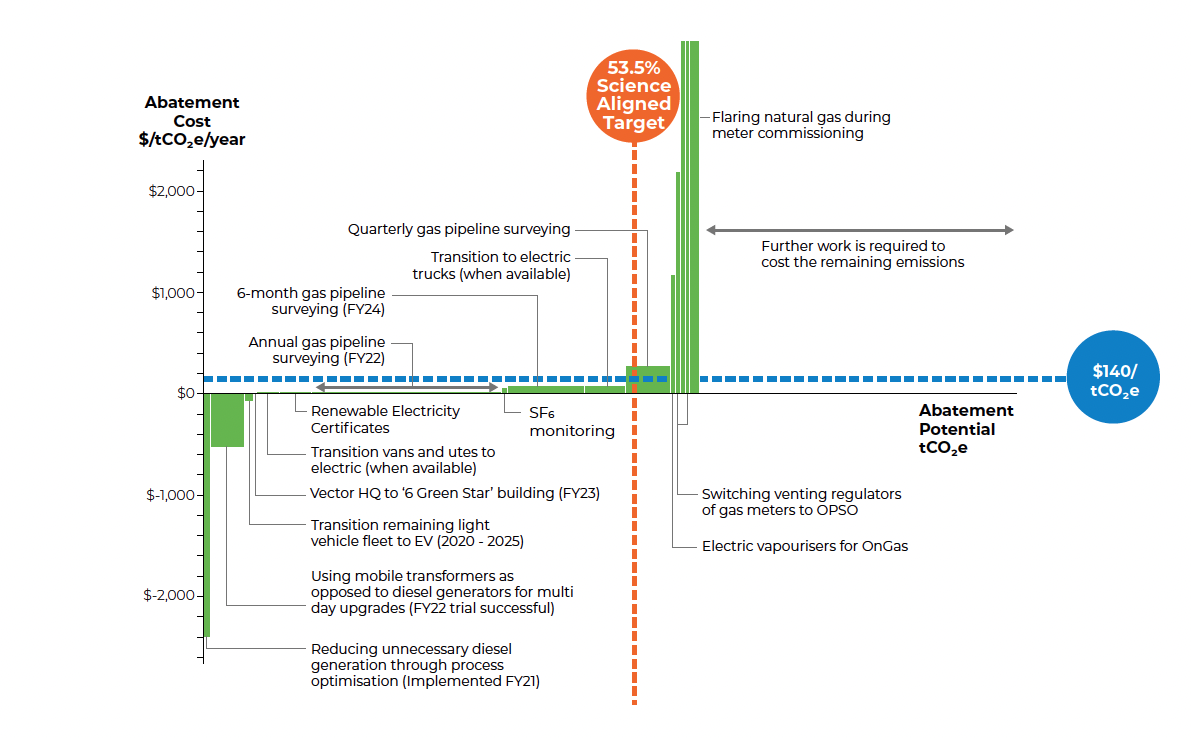
This important work identifies what sort of emissions can be reduced, and how much it costs to do so. When reading the carbon abatement curve, the width of the green bars indicates how much carbon can be abated or decreased, while the height of the bars indicates the abatement cost (or saving) per unit of CO2.
The length of the horizontal axis is Vector’s total direct emissions. Our analysis revealed that around 45% of initiatives can be achieved with very modest expenditure (those with very short or no bar heights), with some initiatives even delivering cost savings (those with negative bars).
Some of the work already in progress as part of this project includes:
· Using mobile transformers instead of diesel generators for multi-day upgrades to our electricity network
· Increasing the frequency of gas pipeline surveying to reduce methane leaks
· Reducing unnecessary diesel generation through process optimisation
· Moving our headquarters to a six green star building
We expect this curve to change yearly as new technologies emerge, we trial new business innovations, and as the costs of the abatement strategies change.